LDC supply growth rate jumps to new high in Q1 2020

The number of long day care centres across Australia increased 4.5 per cent in the three months ended March 2020 (compared to the same period last year), the fastest rate of growth in this data series for at least five years, according to the Australian Children’s Education and Care Quality Authority’s (ACECQA) latest NQF Snapshot.
The growth highlights once again that anticipating reductions in new centre development and service approval applications has been futile in recent years, as developers continue to press forward with their opening plans and new centres come to the market.
That being said, the latest snapshot is essentially pre-covid-19, and it is quite possible that the three months ended June 2020 will show a quite different picture with centre closures very possible, if not likely.
As at 31 March 2020 there are now 8,011 new long day care (LDC) services across Australia. This compares to 7,669 this time last year and 6,859 five years ago.
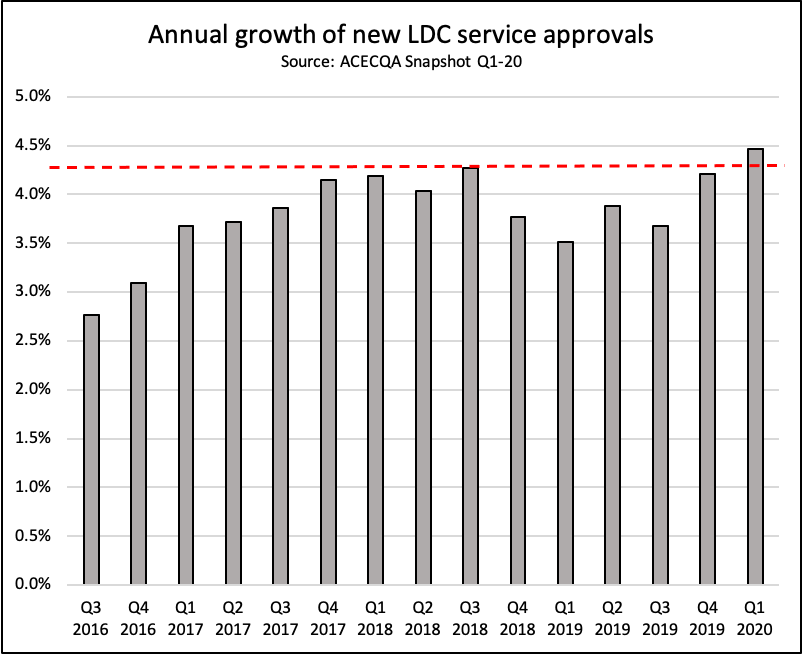
The growth rate of 4.5 per cent tops that recorded in Q3 2018, which was the first full quarter after the new child care subsidy (CCS) regime was introduced and new centre opening growth was at 4.3 per cent per annum.
It is important to recognise that early education supply and demand dynamics are localised, so a national snapshot may not be representative of a particular catchment’s characteristics, but as a guide to overall trends provided value.
Growth rates pick up across states and territories but South Australia stand out this QTR
The rate of growth of LDC services across states and territories was relatively well spread, with the larger states of New South Wales, Victoria and Queensland showing growth of 3.9 per cent, 4.3 per cent and 5.6 per cent respectively, all of which were at the top of end of the recent growth ranges.
However, the smaller states and territories put in stronger growth performances,with the ACT growing at 5.2 per cent, South Australia 6.6 per cent, and Western Australia 4.7 per cent, all of which were quite substantially higher than recent experience and in the case of WA a new record.
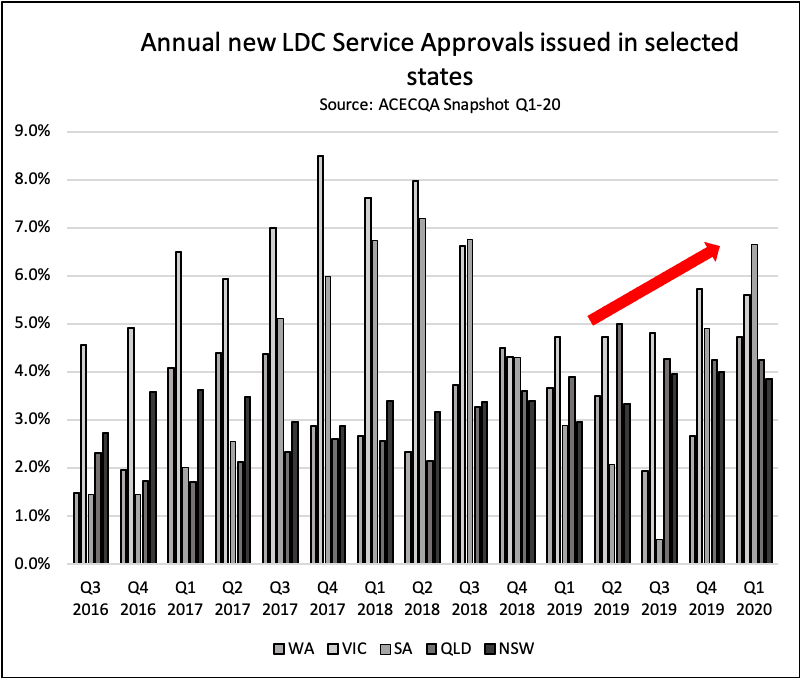
Of particular note was South Australia which having seen growth rates fall down to 0.5 per cent per annum in the three months ended September 2019, moved back to 4.9 per cent in the three months ended December 2019 and then 6.6 per cent in the three months ended March 2020.
There does not appear to be any specific catalysts to have driven the resurgence in development activity in South Australia, or the other states and territories for that matter and with many of the larger operators having delivered their greenfield pipeline commitments it would seem these new services will likely be operated by smaller organisations, some of which may be first time operators entering the sector.
Pre-school and Kindergarten service approvals for third QTR in a row
The number of preschool and kindergarten service approvals fell by 1.8 per cent compared to the same period last year and marked the third consecutive year on year fall in service approvals.
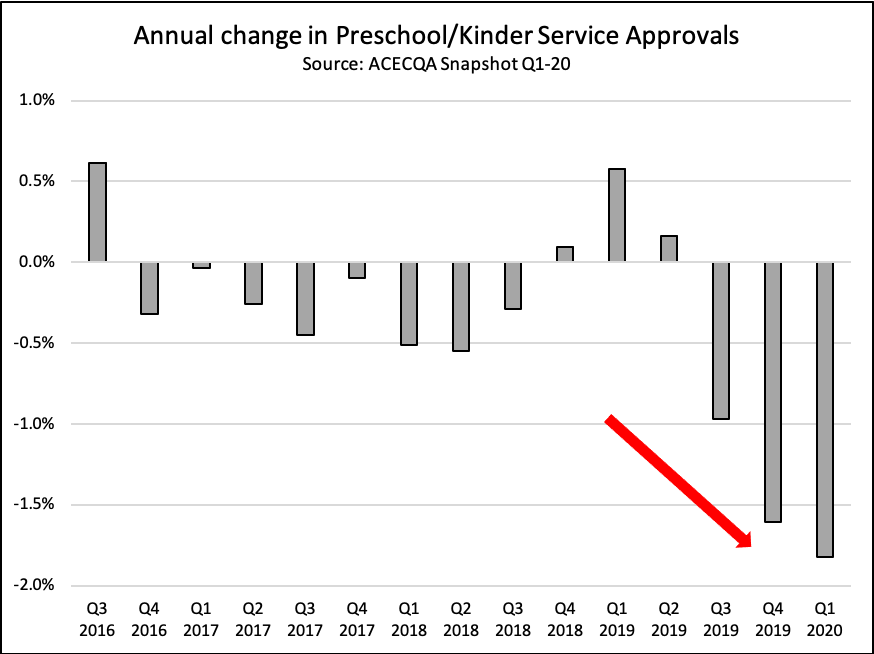
With the exception of the Northern Territory, all states and territories recorded a contraction in service approvals, with NSW leading the way at 3.4 per cent fewer approvals this year compared to last and then VIC and QLD following up with 1.4 per cent and 1.7 per cent reductions accordingly.
The fall in new kinder/preschool licenses relative to the rise of LDC licenses continues to push the ratio of LDC to kinder/preschools higher, with there now being around 2.61 LDC services for every kinder/preschool service, up from 2.23 in 2016.
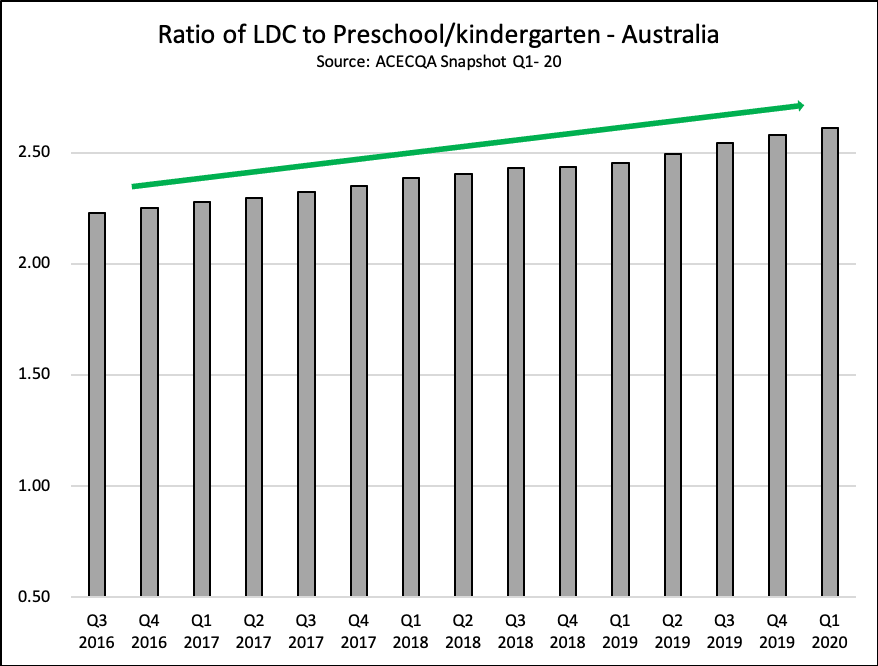
The relative numbers of LDC’s versus kinder/preschool services varies across the country. In NSW there are 4.18 LDCs per preschool, VIC has 1.38 LDC services per kindergarten, and WA has a huge 35.50 LDCs per preschool. That being said, irrespective of state or territory the long term trend continues to signal LDCs over preschools/kindergartens when it comes to numbers.
OSHC service growth moderate and FDC contracting but at a slower rate
The number of Outside School Hours Care (OSHC) services showed a small annual increase of 1.1 per cent in the three months ended March 2020 which is more or less consistent with previous quarters.
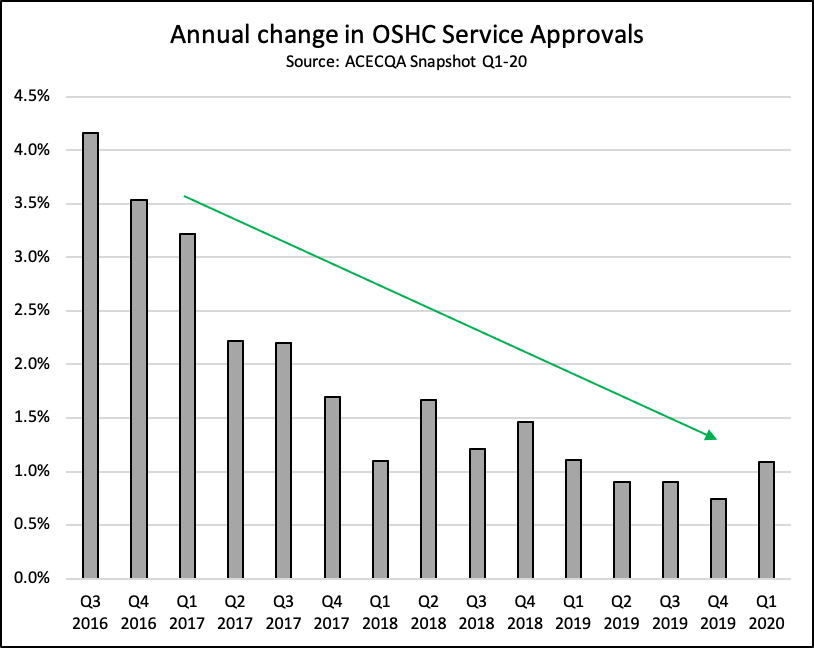
Overall OSHC growth rates have been positive for the last four years but have been trending lower from the 4.0 per cent and above levels of 2016 to around the 1.0 per cent levels in late 2019 and 2020.
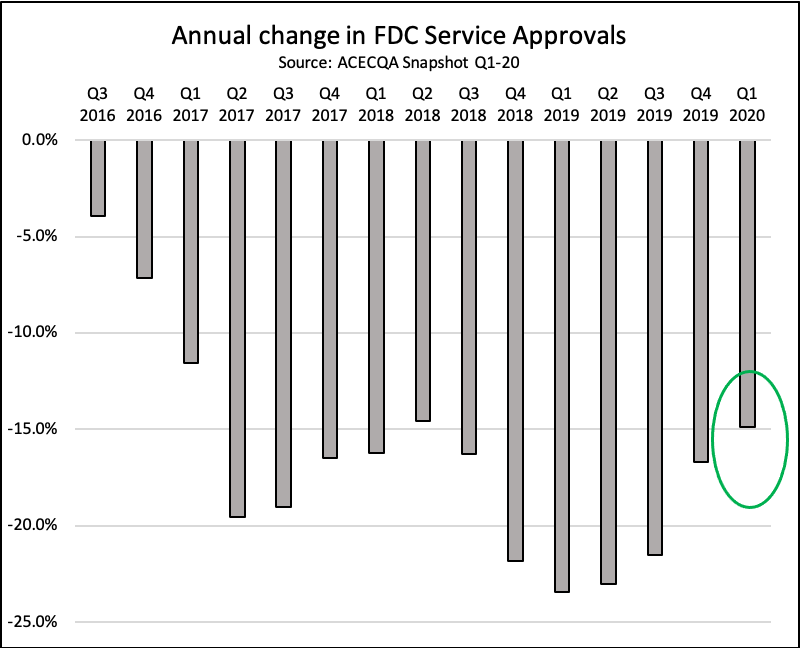
Family Day Care (FDC) schemes continued to contract in the quarter, down 14.9 percent year on year, but this rate of fall was actually the lowest recorded since early 2017 when the FDC purges began in earnest.
NSW now has 170 schemes which is an extraordinary 74 per cent lower than the number recorded in the three months ended March 2016. Victoria has 173 schemes which is 55 per cent lower.
What is unclear at this juncture however is just how COVID-19 has impacted these particularly vulnerable parts of the ECEC sector.
We know that OSHC services were hit very hard by school closures and directives for children to be kept home and we know LDC has been hit hard by funding uncertainties as well as the stay at home directives.
The Q2 2020 ACECQA snapshot will provide a very valuable insight as to just how hard these settings were impacted but also the broader ECEC sector as well.
To read the Snapshot please click here.
Download The Sector's new App!
ECEC news, jobs, events and more anytime, anywhere.


Latest in Economics

Economics
Provider
Childcare properties continue strong run in national commercial auction series
2025-07-04 11:00:52
by Fiona Alston

Economics
Provider
Quality
Workforce
New public preschools to boost early learning access in Sydney’s north-west
2025-07-04 08:30:36
by Fiona Alston

Economics
Provider
Embark Early Education flagged as “Strong Buy” despite modest ROE
2025-07-04 08:00:27
by Fiona Alston

Popular