Need a behaviour chart? Check yourself first
sponsored
opinion
The views expressed by contributors are their own and not the view of The Sector.

Sticker charts, rewards, and positive reinforcement systems are commonly used to ‘shape’ children’s behaviour into complying with adult expectations. While these can be rewarding for the adult and somewhat effective in the short term, possibly even creating some behaviour change while the system is in place – there is little research to suggest these systems actually teach children to make reasoned judgements about their own behaviour in the long term.
What we do know, however, is that these positive reinforcement systems increase the likelihood that an educator will have more positive interactions with a child than negative ones (Boom!).
The “magic ratio” (Gottman 1999) is said to be about 5:1 positive:negative interactions. It’s a no-brainer that a relationship with more positive interactions is going to create a more positive tone in the relationship and the learning environment. Knowing that we are supporting children’s behavioural and social learning – how do you think a positive relationship will impact on the teaching and learning of behavioural expectations?
So, what would happen if we ditch the rewards charts and just focus on our interaction ratio? I’ll tell you what’ll happen – Success!
So let’s get started on making a plan. Firstly, let’s think of a child who is currently challenging us with their behaviour. Tick off the types of interactions you are having with this child and estimate how many of those interactions you might have in an hour, a session, or a day.
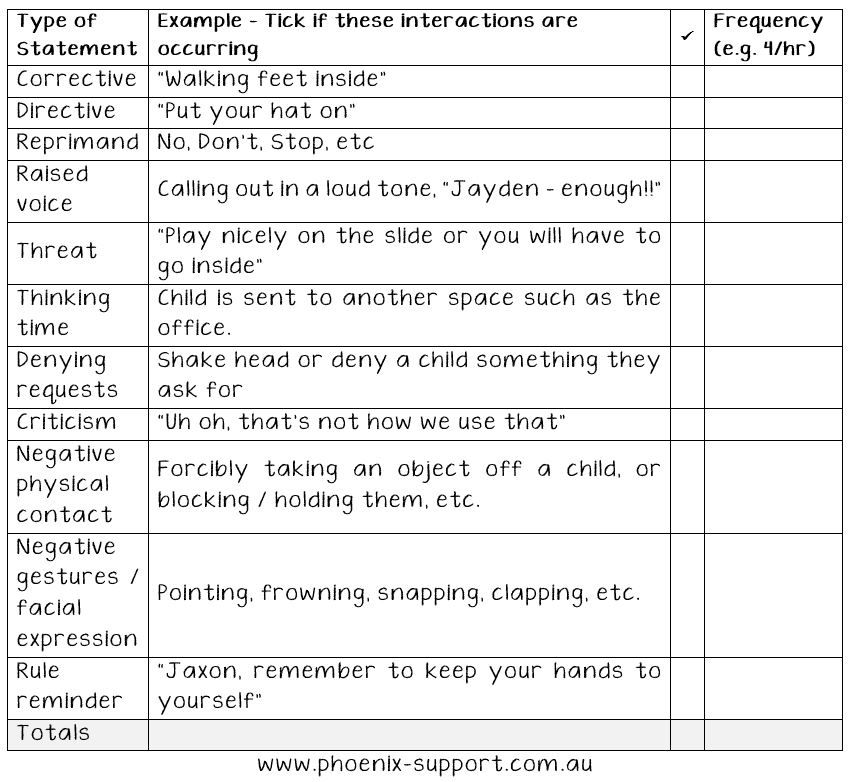
Remember that correctives and directives still count as a negative even if we’ve said them sweetly with a smile. Think about your own interactions. If one of the people you live or work with gave you, for example, 4 correctives or directives in an hour with 1 or 2 positives in that time, after a while it will strain your relationship or at least test your patience. 5:1, it’s science. These interactions effect children in the same way, they are only human, after all.
Time to do some math…
Considering the above guestimates, approximately how many negative interactions are you having with the child in a day? ________________
Now times that by 5 = _________ . This is the number of positive interactions required with the child to balance your interaction ratio to ensure a supportive and constructive relationship in which learning can occur. Is that achievable? Awesome! Keep up that great work.
OR
Is it impossible, given your environment, ratios and workload? If that is the case – we need to keep working on it. Let’s continue.
Back to the math. Say, for example, we tallied 4 negative interactions in an hour. According to Gottman’s Magic Ratio, we now need 20 positive interactions to maintain a positive relationship with this child. Obviously if your number of positive interactions required in a day is 160, you are going to struggle to get there. So – we need to work on reducing / neutralising the negative interactions at the same time as increasing the positives. Using the strategies like the ones in our post about the Love Cup Filling Connection Plan, it’s time to shake up your interaction ratio. Let’s try that then observe your interactions using the scales below.
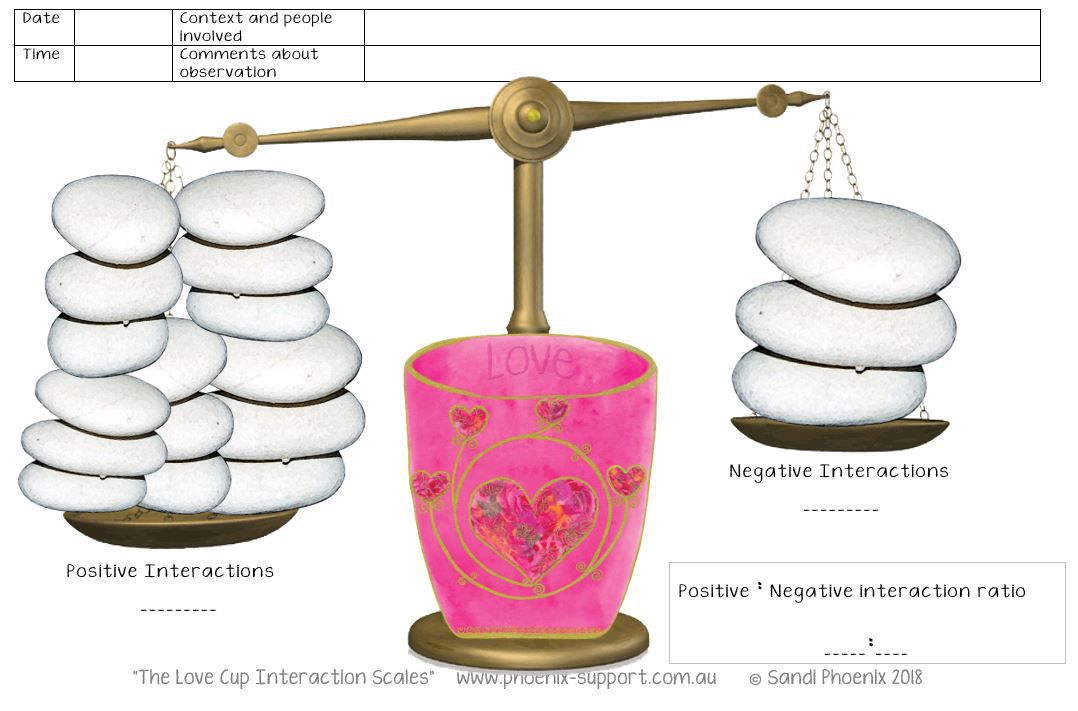
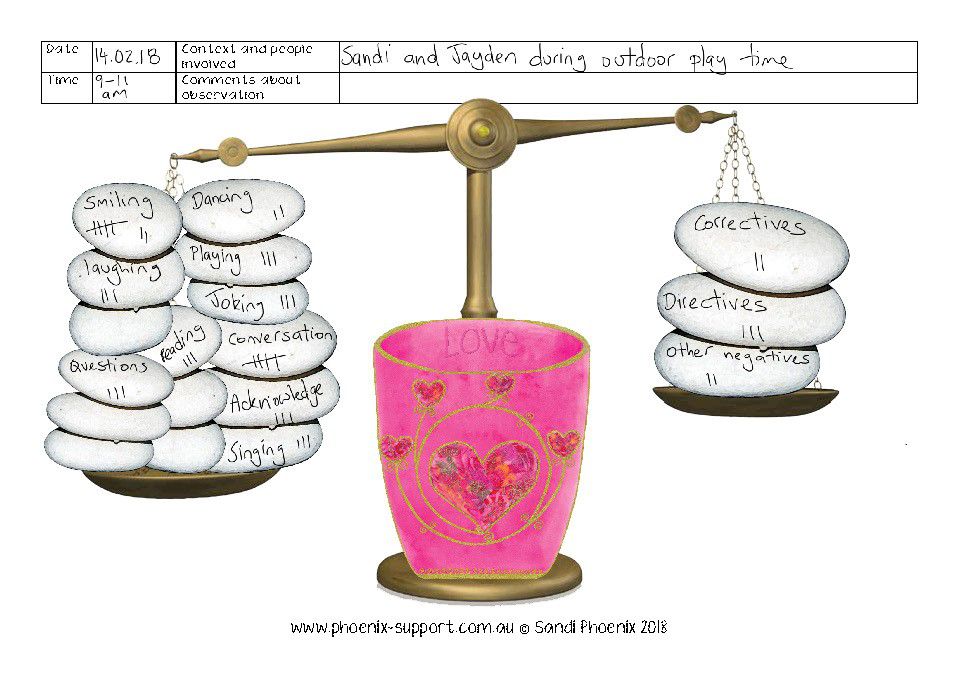
This tool can be used flexibly to meet your needs and style. Here’s one sample of how it could be used to tally interaction ratios. However, you could use it to simply mark a tally, write comments / interactions in each stone, or colour / cross a stone when you have an interaction.
We can’t wait to hear how this transforms your interaction ratio. To learn more about supporting children’s behaviour, why not attend one of our upcoming Behaviour Masterclasses?
Happy cup filling! You’ve got this!
Share your successes and thoughts on social media with #phoenixcups. Join our Facebook Group – The Phoenix Cups Resource– to share your success and discuss more cup-filling strategies!
This article is Part B of a Phoenix Cups Love Cup Filling Plan series. To view Part A: Love Cup Filling Connection Plan
Feel free to download these Phoenix Cups – Love Cup filling plan PDFs The Love Cup Interactions Scales and Love Cup Filling Connection Plan and print out for all of your colleagues.
* The Phoenix Cups © is a conceptual framework proposed by Sandi Phoenix for understanding children’s behaviour and designing effective plans to support behavioural and social learning.
Download The Sector's new App!
ECEC news, jobs, events and more anytime, anywhere.


Latest in Quality

Practice
Provider
Quality
Research
Workforce
New activity booklet supports everyday conversations to keep children safe
2025-07-10 09:00:16
by Fiona Alston

Practice
Provider
Quality
Workforce
Southern Cross University defends early childhood course amid enrolment and placement concerns
2025-07-10 08:15:48
by Fiona Alston

Policy
Practice
Provider
Quality
Adelaide early learning centre under investigation for image handling practices
2025-07-10 07:30:10
by Fiona Alston

Popular

Policy
Practice
Quality
Provider
Research
Safety starts with supervision: responding to real risks in ECEC
2025-07-07 10:30:58
by Fiona Alston

Policy
Provider
Practice
Quality
Jay Weatherill appointed to co-lead urgent review into childcare safety in Victoria
2025-07-07 07:24:04
by Fiona Alston
Practice
Provider
Quality
Research
Workforce
New activity booklet supports everyday conversations to keep children safe
2025-07-10 09:00:16
by Fiona Alston