LDC continues to be standout beneficiary post CCS

The Federal Department of Education and Training (DET) have released the second issue of their quarterly Child Care in Australia information report since the implementation of the Child Care Subsidy legislation in July 2018 which shows services in long day care (LDC) settings continuing to perform well.
The report, which covers the three months ended December 2018, amongst other things confirms that despite overall attendance levels remaining more or less unchanged, the number of children attending LDC services continued to rise strongly.
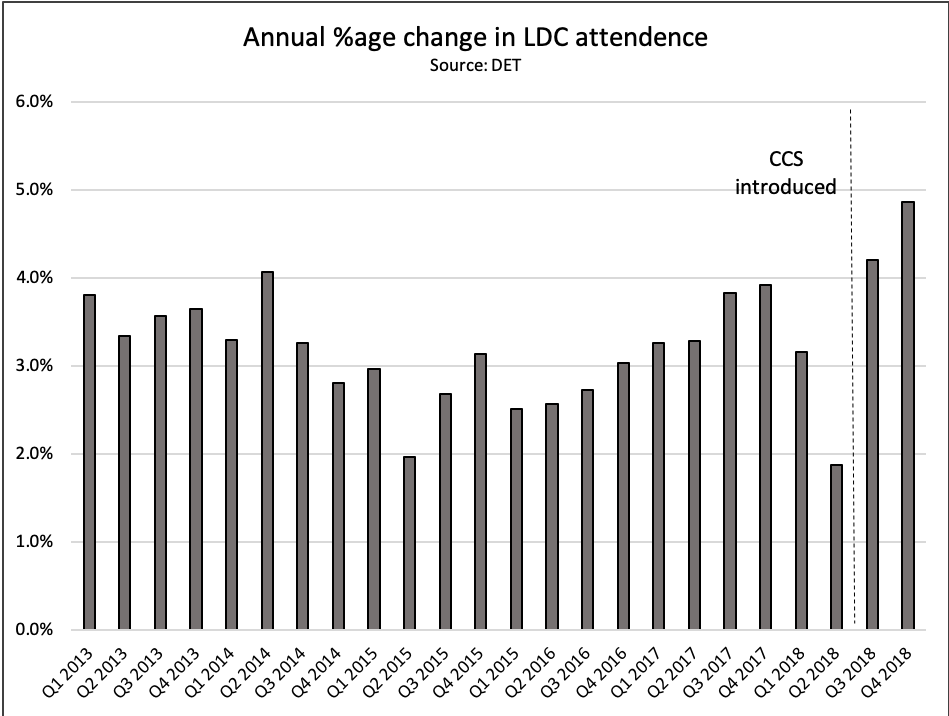
Year on year growth of enrolments at LDC centres was 4.9 per cent higher in the December quarter compared to last year, whereas attendance at family day care services was 26.0 per cent lower.
Interestingly, the total amount of enrolments gained by long day care centres (35,170) fell short of the total amount lost by family day care centres (44,610) and suggests that families leaving FDC settings are not automatically seeking care in the LDC space.
Outside school hours care attendance remains well supported up 5.0 per cent on the same period last year.
Number of hours attended per week moderates after strong upswing in Sept quarter
After a large jump in hourly usage of care at LDC services post the introduction of the CCS there was a moderation with annual growth of 2.4 per cent compared to 6.9 per cent in the September quarter.
This continued, albeit slower growth, suggests that the propensity for families to increase the number of hours in a long day care setting in the wake of the CCS introduction has been sustained into what is a historically quieter period of the year.
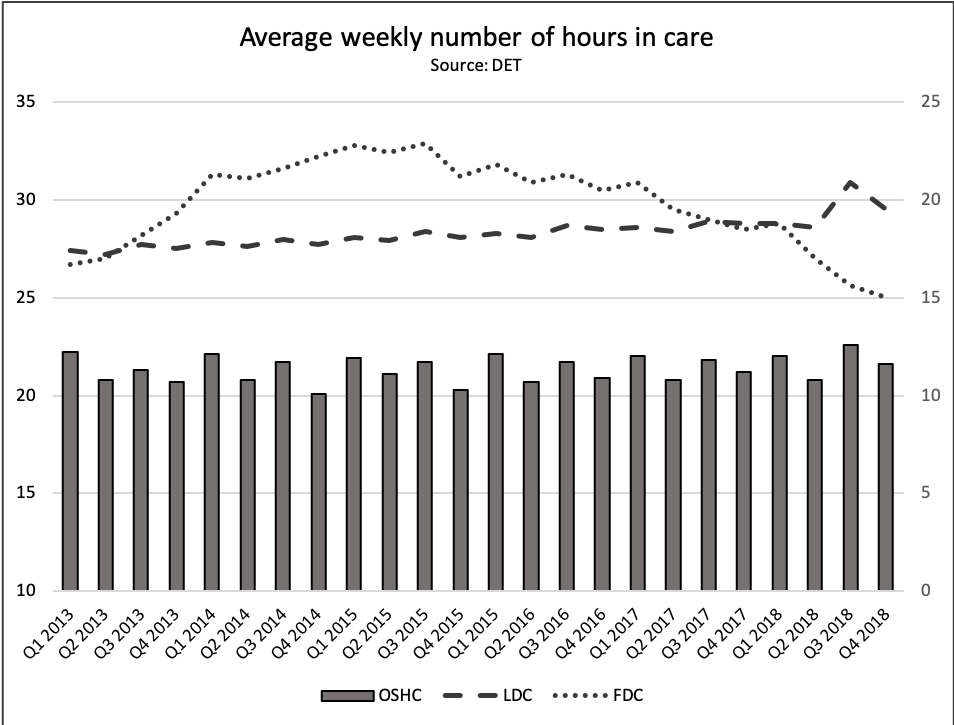
Weekly attendance in family day care continues to slide and in OSHC, although higher than the same period last year, was within the bounds of previous quarters.
ACCS funding bounces but is still well below pre CCS levels
The number of disadvantaged and vulnerable families and their children receiving additional child care subsidy (ACCS) increased compared to the September quarter 2018 but still remain well below the numbers recorded under the previous subsidy regime, around 18 per cent and 20 per cent respectively.
This substantial fall reflects the stricter rules built into the CCS that has seen documentary evidence required to support each and every application, and the introduction of Centrelink as the ultimate arbiter as to whether applications are successful or not.
That being said there has been an increase in ACCS disbursements since the September quarter with child well being and transition to work related payments seeing substantial increases.
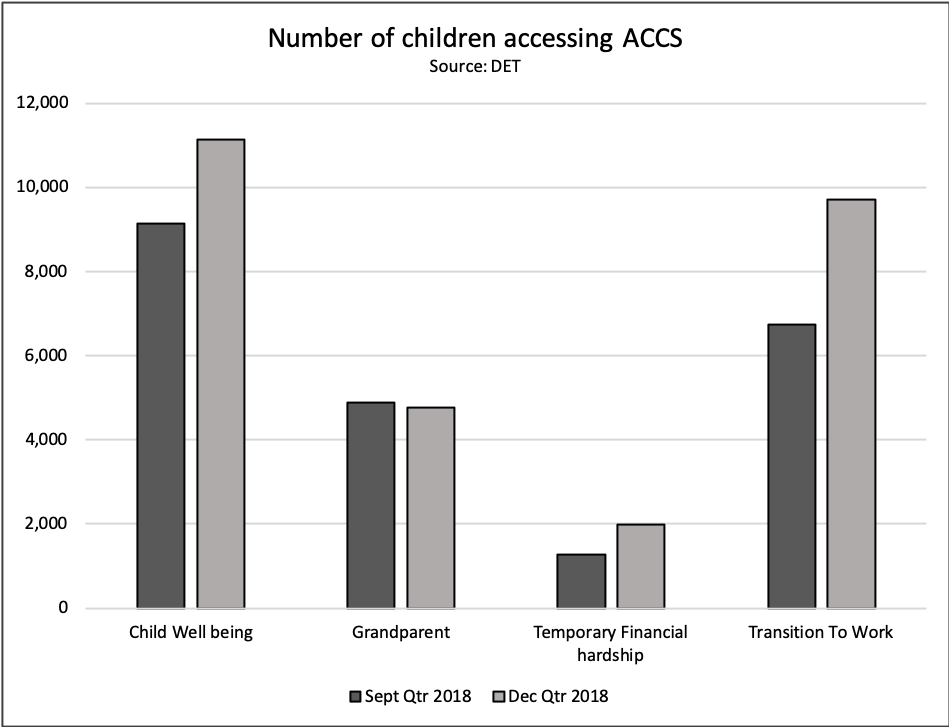
It is unclear what has driven these particular increases although clearance of backlogs at Centrelink and a clearer understanding of the new rules may have been contributing factors.
Percentage change in gross hourly LDC fees steady with 11% of services over fee cap
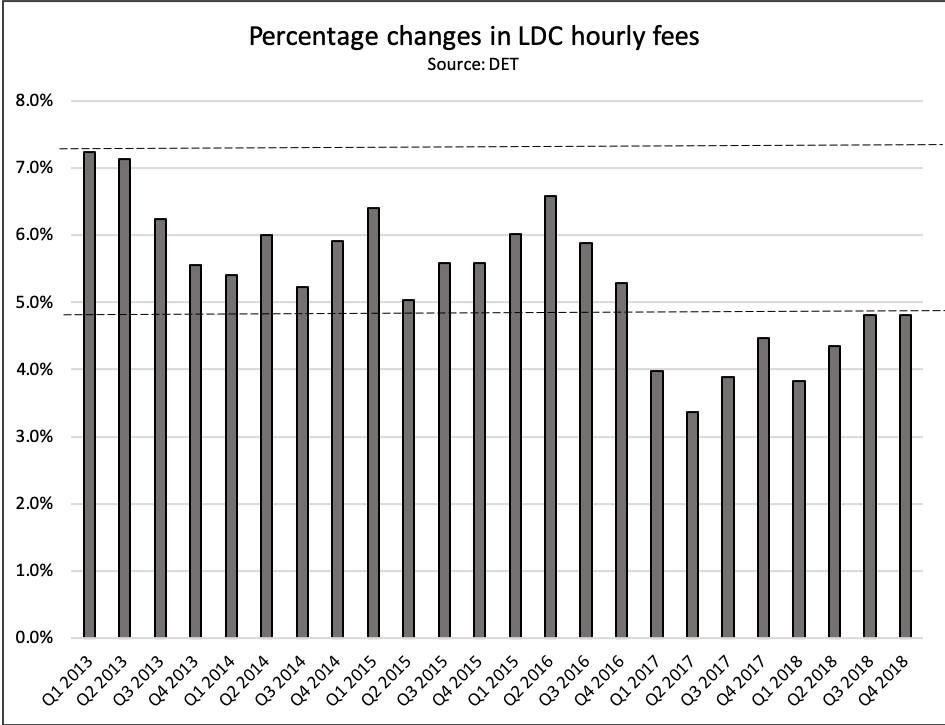
Consistent with recently reported Australian Bureau of Statistics child care prices data, the Federal DET confirms that fee increases in LDC settings continue to annualise at a rate lower than experienced in the period 2013 to 2016.
This is notable as the ABS data looks at a net fee ie: post subsidy, and the DET the gross fee, ie: pre subsidy.
According to the DET data prices rose 4.9 per cent in the December quarter 2018 compared to the same period in the previous year and have not seen any meaningful acceleration since the introduction of the CCS.
Notably, in this latest release the DET have provided additional statistics around the number of centres that are charging fees over the fee caps stipulated within the CCS. This provides a clear line of site as to the most “expensive” suburbs relative to the “cap” across Australia.
In the LDC setting, 11 per cent of all services were charging hourly fees above the $11.77 fee cap with the areas of North Sydney – Mosman, Eastern Suburbs – North, Leichhardt, Ku-ring-gau and Manly having the highest concentrations of such services in the country.
In the OSHC setting, 15 per cent of all services were charging hourly fees above the $10.29 fee cap with the areas of Stonnington – West, Mid West, Belmont – Victoria Park, Whitehorse – West and Cottesloe – Claremont having the highest concentrations of such services in the country.
The most expensive states from an LDC perspective were the Australian Capital Territories with 89 per cent of catchments having at least one service with a price above the fee cap, Western Australia with 62 per cent and Victoria with 55 per cent. Queensland, Tasmania and the Northern Territory had 10 per cent or less.
From an OSHC perspective Victoria had the largest proportion of catchments with at least one centre charging over the cap with 86 per cent of catchments and Queensland the smallest proportion with 10 per cent of catchments.
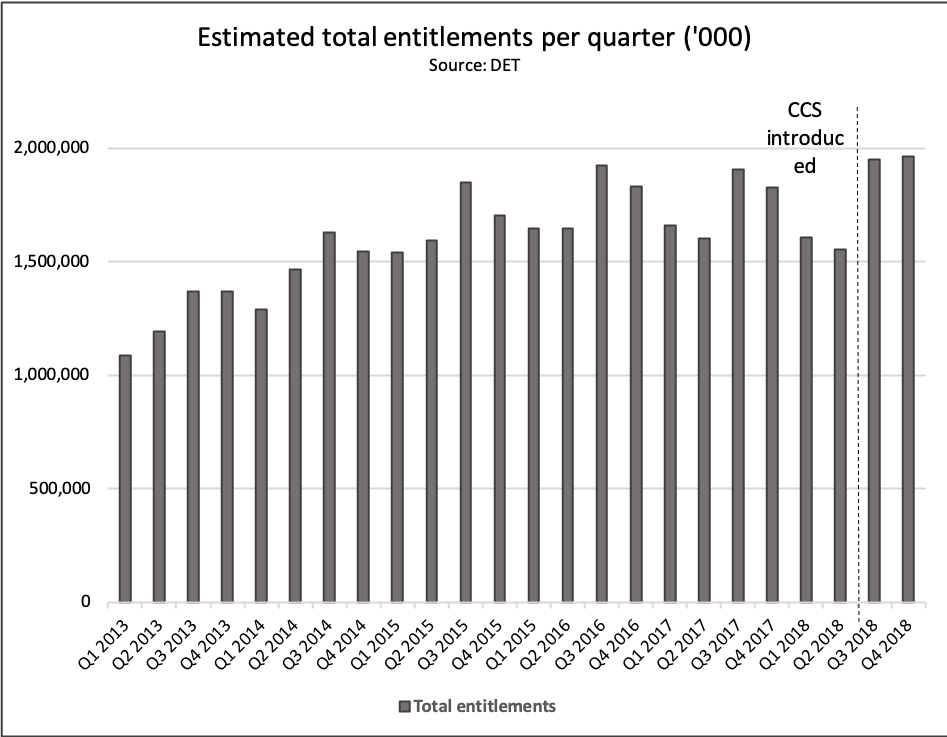
Total Government subsidy spend edges to new record in Dec quarter
Following on the new record set in the September quarter of 2018, the DET data confirms that total government subsidy spend in the December quarter was higher by a further 0.6 per cent taking the spend to $1.96 billion.
The DET report does not provide a breakdown of how the funding is distributed across different settings at this juncture.
Download The Sector's new App!
ECEC news, jobs, events and more anytime, anywhere.


Latest in Economics

Economics
Provider
Workforce
Tipalea breaks ground on $9 million Howrah childcare centre to meet urgent demand
2025-07-18 10:32:49
by Fiona Alston

Economics
Quality
Policy
Practice
Provider
Research
It’s time to rethink early childhood in Australia
2025-07-18 10:16:33
by Fiona Alston

Provider
Economics
G8 Education defends disclosure timing as share price plunges amid investor scrutiny
2025-07-16 09:00:14
by Fiona Alston

Popular

Policy
Practice
Provider
Quality
Spot checks, CCTV and scrutiny of Working With Children Checks: sector responds to child safety crisis
2025-07-07 07:15:26
by Fiona Alston

Quality
Practice
Provider
Research
Workforce
Honouring the quiet magic of early childhood
2025-07-11 09:15:00
by Fiona Alston

Policy
Practice
Provider
Quality
Workforce
Minister Jess Walsh signals urgent action on safety and oversight in early learning
2025-07-11 08:45:01
by Fiona Alston